Your Raynaud’s and You – Insights from SRUK’s work on the Raynaud’s App
Can you imagine a world where we could have a greater understanding of Raynaud’s? Have more information on what triggers an attack? Understand how in some cases Raynaud’s combined with other symptoms may be an early predictor of scleroderma? The Raynaud’s ResearchApp, an SRUK-led partnership with app development company Healthbit and data company D4T4, intends to do just this!
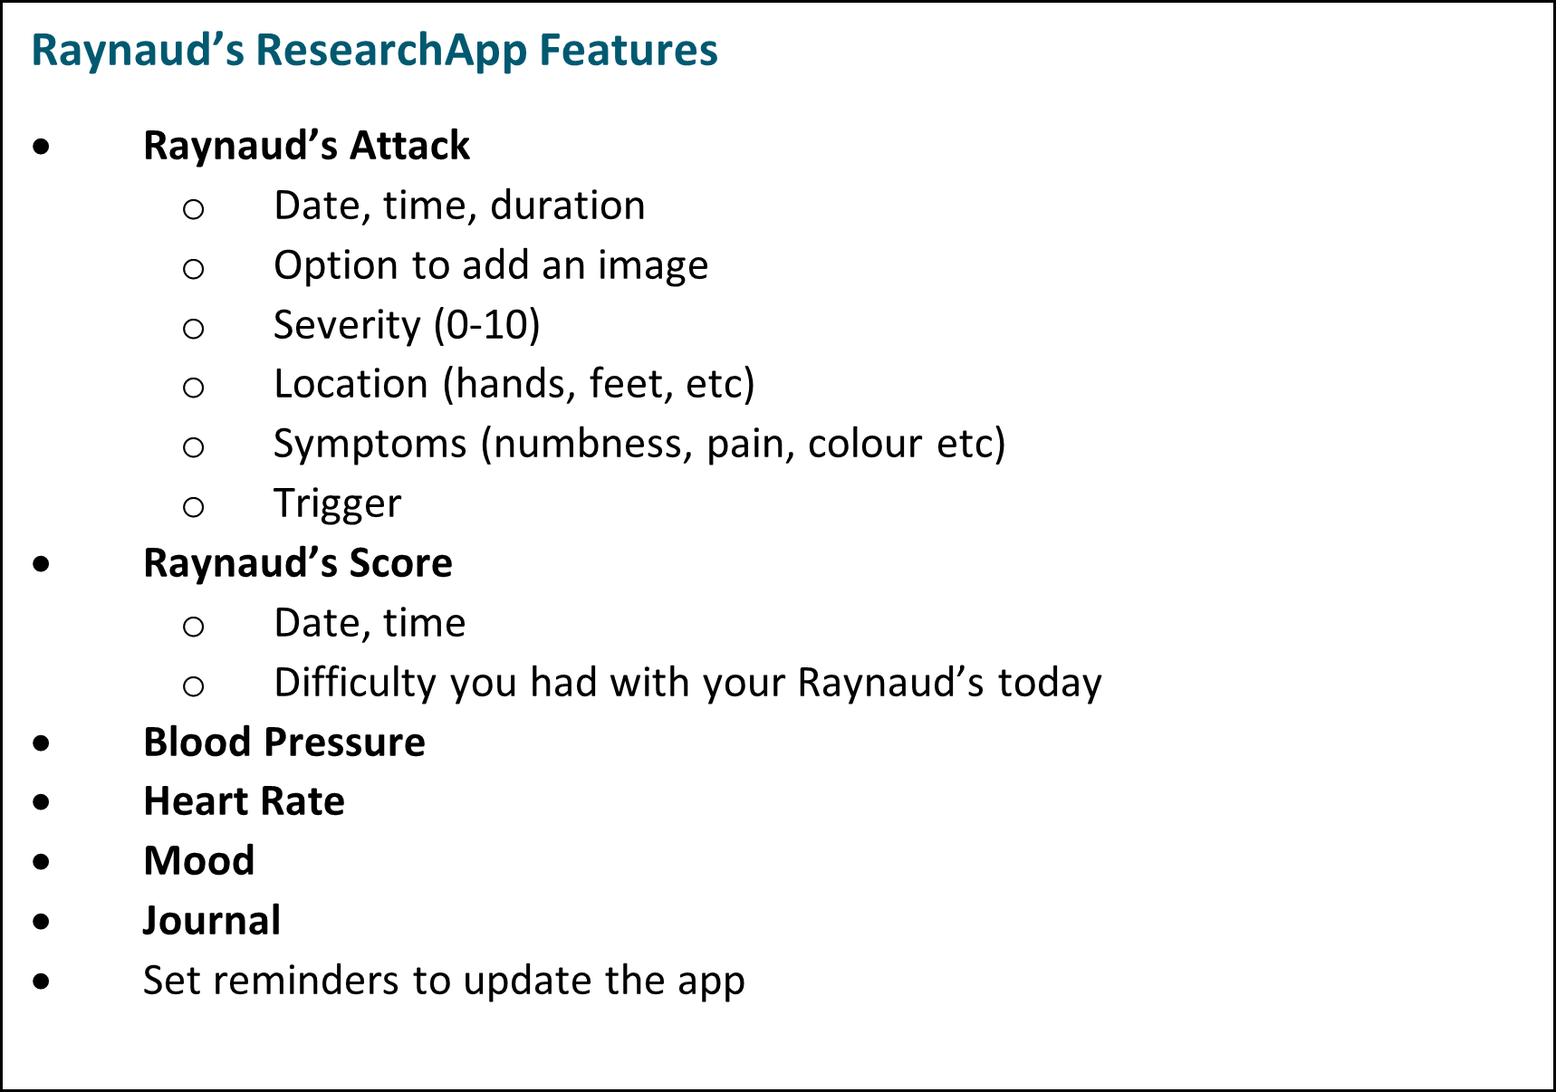
SRUK has developed Version One of a symptom tracking app called the ‘Raynaud’s ResearchApp.’ The App can be used on a daily basis by those living with Raynaud’s to capture information about their attacks and any contributing lifestyle factors (see the box below). The App is being piloted within a group of people living with severe Raynaud’s, who also have other risk factors meaning that they have a greater chance of developing scleroderma. They are being clinically assessed every six months as part of a study which captures clinical data collected through blood tests and imaging data. This sits alongside the patient-reported data captured daily via the App: including the number of attacks, their duration and severity along with lifestyle data allowing clinicians to gain detailed and developed insights into Raynaud’s and factors that could eventually indicate progression to scleroderma.
Over the pilot phase SRUK identified that the App could also be an empowerment tool for our community, by helping those either with Raynaud’s or who think they may be affected to track and learn more about their condition. This year, to mark the end of Raynaud’s Awareness Month during February, we offered the opportunity for a limited number of our community with severe Raynaud’s the chance to use the App. 206 people responded to our call and completed the ‘baseline’ survey, which explored user’s attitudes and motivations for tracking their symptoms, along with their experiences of Raynaud’s. The App saw 129 active users during the test period, of whom 78 completed our feedback survey about their experiences using all the features that the App offers. The anonymised data from these ‘before’ and ‘after’ surveys provided interesting insight into your Raynaud’s and your attitudes and motivations.
The ‘Before’ Picture
About You
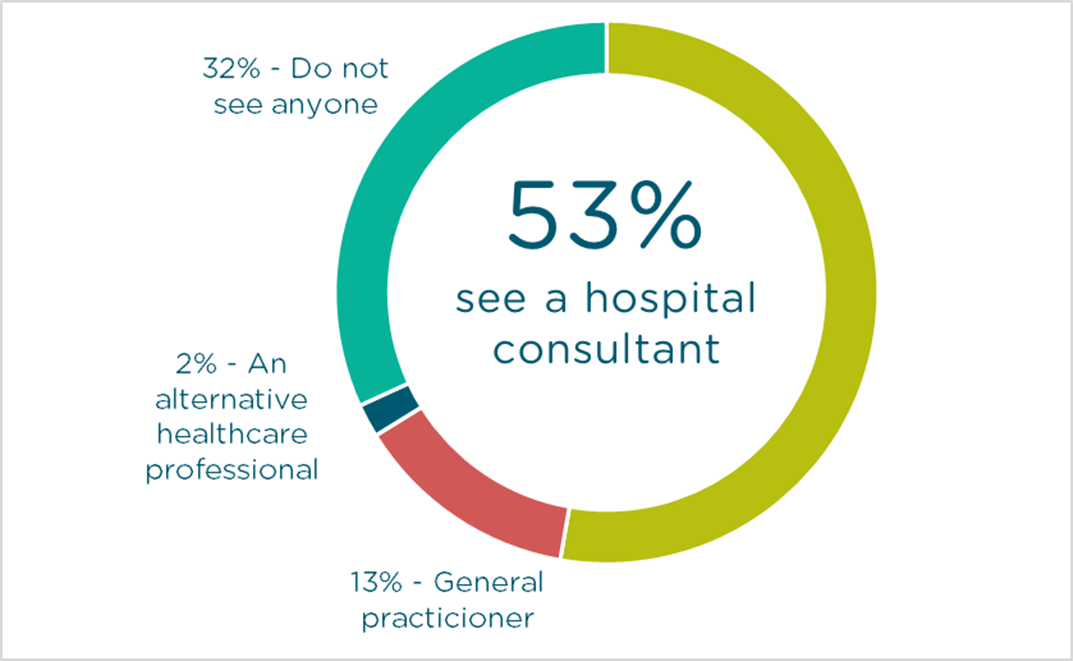
Raynaud’s is more commonly experienced by women, and in-line with this, the majority (87%), of those who responded to our survey and engaged with the App were female, aged between 36-50 and 51-70 years old. 85% of you had received a formal diagnosis of Raynaud’s and 68% of you regularly see a medical professional (the majority being a hospital consultant) about your condition.
Figure 1: Do you regularly see a healthcare professional about your Raynaud’s?
Your Experience of Raynaud’s
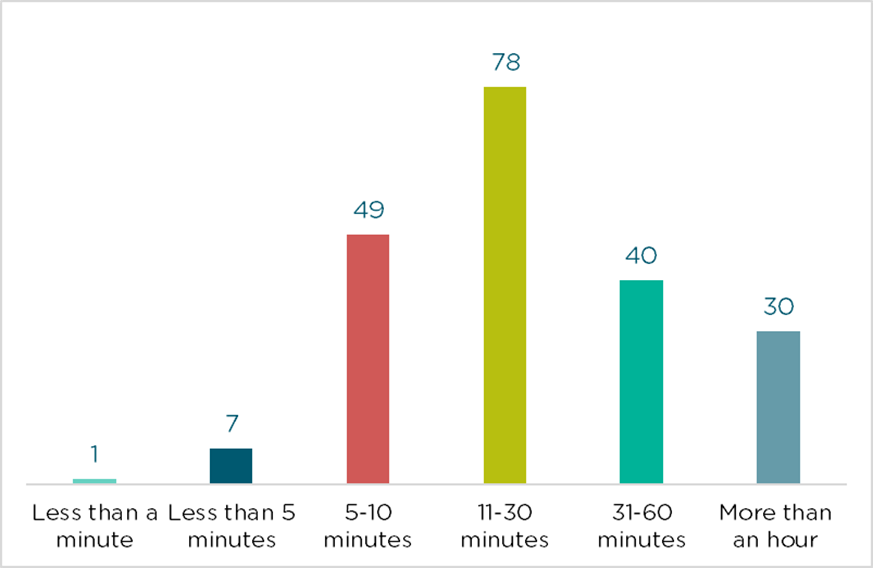
Individuals have varying experiences of Raynaud’s and may find certain aspects of their condition more or less troublesome than someone else. Some may have more attacks which are of shorter duration, others perhaps fewer attacks that last longer. Because of this, it is difficult to set an objective measure to assess ‘severity’. To understand more about your Raynaud’s, we were keen to understand how many attacks you typically experience in your worst week of the year, and how long your attacks tend to last for. Between users there was a natural variation in how frequently Raynaud’s attacks were experienced, however when asked to describe their worst week, 73% of our community stated that they had at least one attack per day, with 59% having several attacks in a day. As expected, the length of an attack was variable, with most people reporting that these lasted between 11-30 minutes. In the most extreme cases, some users reported several attacks a day, which were on average one-hour in length, showing the huge impact that Raynaud’s can have upon day-to-day life, affecting larger portions of the day. What will be interesting to examine across the next year as we gather more data is the seasonality of Raynaud’s – how linked are attacks to the time of year, and by extension the outside temperature, compared to the other lifestyle factors that the App records?
Figure 2: In your worst week for Raynaud’s, how often did you experience an attack?
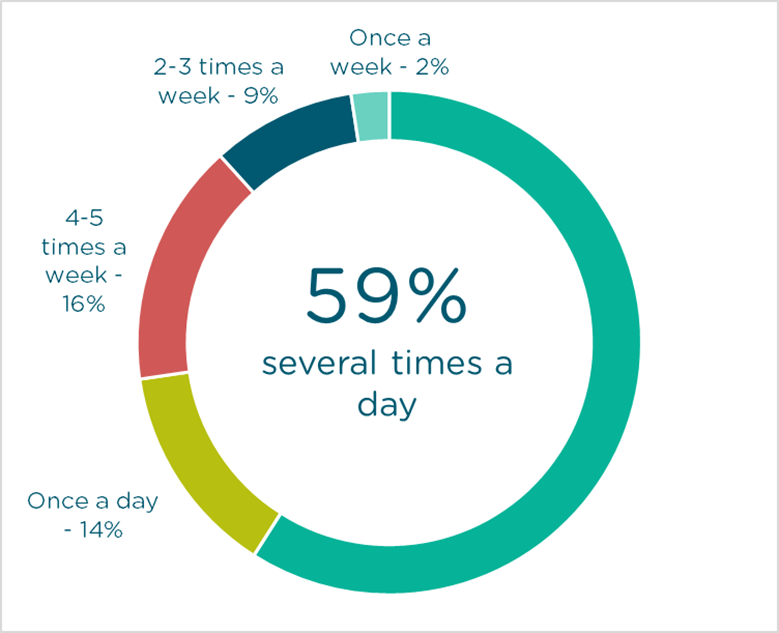
Figure 3: How long does your average Raynaud’s attack last?
Using the App – Why?
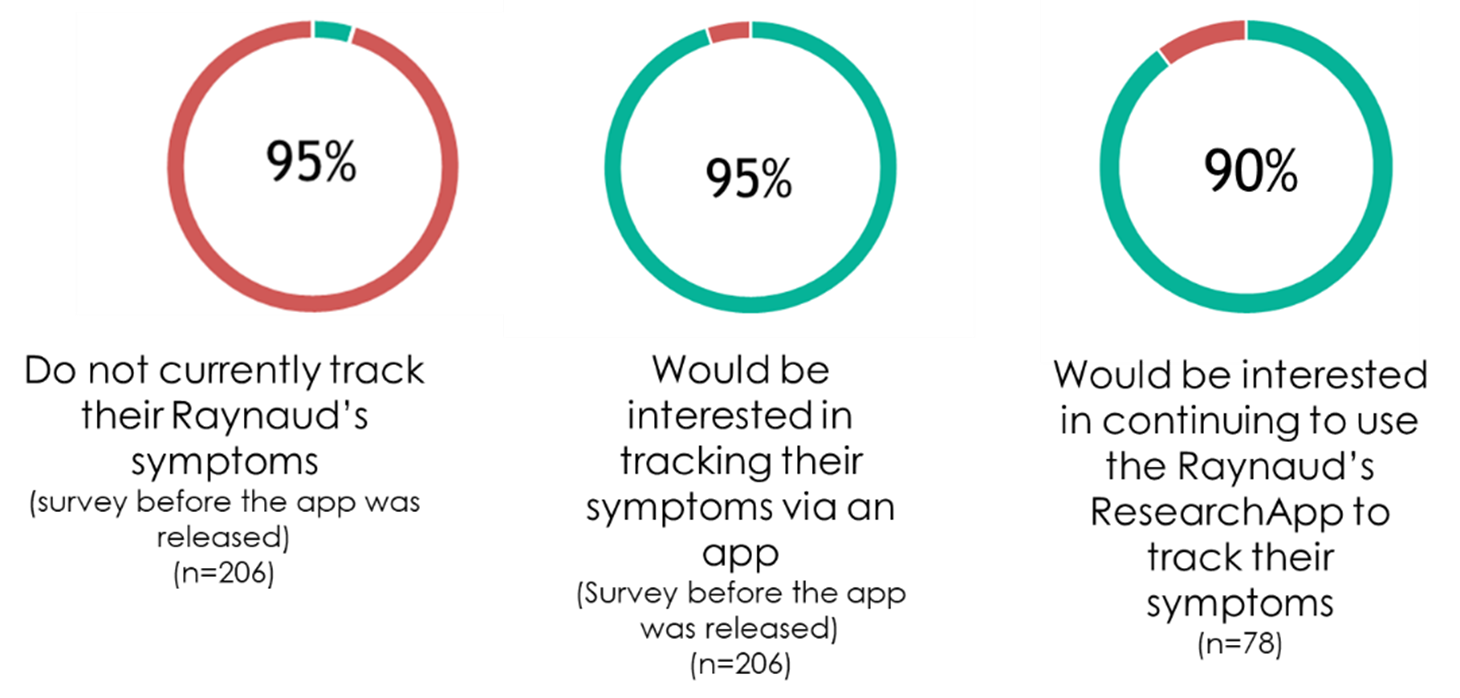
We were interested in understanding our community’s attitudes to tracking symptoms and their motivations for using the App before and after use. In the ‘before’ survey that you completed prior to using the App, just 5% of you stated that you track your symptoms through making notes on your phone or by taking photos of your fingers during an attack. 95% of you answered that you would be interested in using an app to keep a record of your Raynaud’s. When we asked you how you would use this data, almost half of you (48%), said that you would use it to share the information with a relevant healthcare professional during appointments. 41% thought that the information you collect could help you ‘gain a greater understanding of my condition’ (41%); and sadly, 11% of you answered that it would help you to be ‘taken seriously by my healthcare professional,’ suggesting that they may have had a lack of awareness of Raynaud’s, or they did not understand the extent to which this affected your life.
SRUK were happy to see that the App was as useful to our community as we had hoped; after using the App for a month, 90% of you wanted to continue!
Figure 4: Symptom tracking
The ‘After’ Picture – insights from one-month of App usage
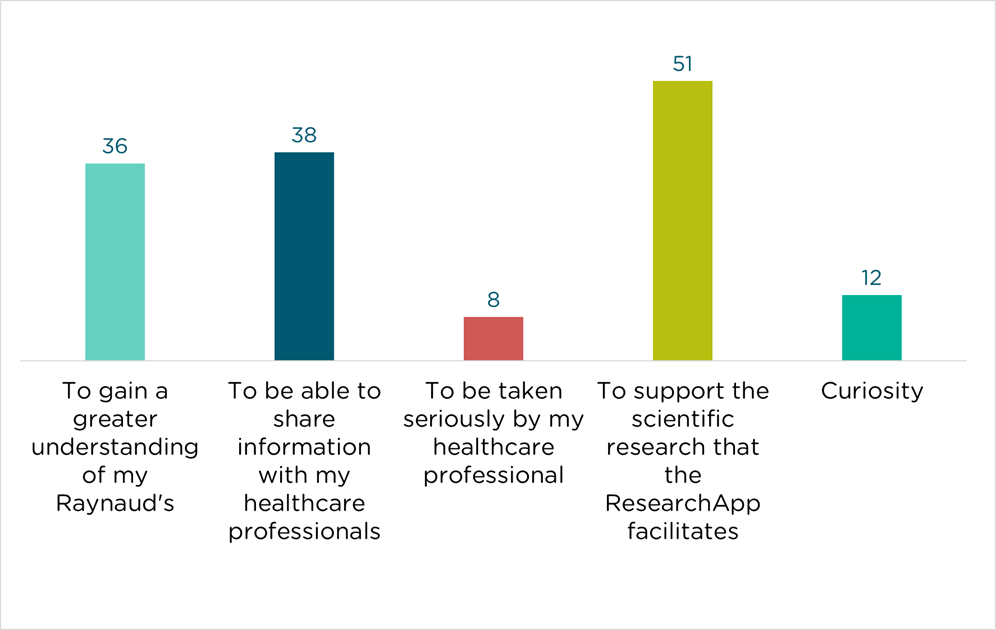
We were interested to see how your motivation for using the App changed after one month of use. After using the App, you still wanted to use it to learn more about your condition and help to communicate/show your health professional what was happening. However, 65% of you also wanted to help scientific research through the data collected via the App. More research is needed to fully understand Raynaud’s and attack triggers, and to gain understanding into the prevalence of the condition and the seasonality since some individuals are affected all-year round.
Figure 5: Why did you download the Raynaud’s ResearchApp?
Your willingness to engage in scientific research was further shown when 98% of you reported that you were happy for your anonymised data to be used for research purposes, and a trend that became apparent when you were asked what additional features should be added to the App was the need to see how your data is being used. A large number requested the inclusion of news articles on the App, specifically ones discussing research and discoveries that result from the data collected.
Overall, 90% of those who engaged with the App for a month want to continue using it to monitor their Raynaud’s in the future, giving it a rating of four stars out of five.
The SRUK research team would like to say a big thank you to those who used the App and completed our surveys. Please do continue to use the App to log your symptoms if you find it useful. We plan to use your feedback to develop Version Two of the App, subject to funding. We hope to tell you more about this exciting project as it progresses.
For now, if you would like to find out about more projects like this first, become a member of SRUK. You can sign up here to join our community of over 1000 annual members whose regular support is helping to fund our research, information and support services.